What Did We Test?
This strategy aims to capture price movements by entering long positions when specific conditions, based on recent price action, signal potential upward trends. The approach uses two indicators: the 20-day high, which reflects the highest price over the last 20 days, and two different exponential moving averages (EMAs). The 10-day EMA, which averages prices over ten days while giving more weight to recent prices, must be greater than the 30-day EMA, a longer-term average. This setup suggests that the short-term momentum is stronger than the longer-term trend, potentially indicating a bullish phase.When the conditions for entry are met, the strategy will exit either when the price drops to the 10-day low or when a trailing stop is reached, set at twice the Average True Range (ATR). The ATR is a measure of market volatility, providing a dynamic stop that adjusts based on recent price fluctuations.
What Happened?
The backtest aimed to evaluate a strategy using price indicators to identify potential upward trends in seven symbols from January 1, 2016, to January 1, 2025. Starting with an initial equity of $100,000, the strategy ended with a value of approximately $207,892, resulting in a total return of 107.89%. However, the strategy lagged behind both benchmark comparisons. The equal-weight buy-and-hold basket achieved a total return of 244,286.40%, while the buy-and-hold QQQ index generated a return of 399.43%.One significant caveat of this backtest is that while it generated a positive overall return, the strategy exhibited a maximum drawdown of 25.63%. This decline was notably less severe compared to the 60.66% maximum drawdown of the equal-weight buy-and-hold basket and 35.12% of the QQQ index, indicating better risk management in this regard. Despite this, the strategy’s overall performance did not match the benchmarks, highlighting the importance of evaluating risk alongside return.
How Did It Compare With the Benchmarks?
The strategy executed a total of 152 trades during the backtest period from January 1, 2016, to January 1, 2025. It achieved a total return of 107.89%, which translates to a compounded annual growth rate (CAGR) of 8.47%. However, this performance lagged behind the benchmark of an equal-weight buy-and-hold basket, which returned 244,286.40%, indicating the strategy underperformed by a significant margin.
The Sharpe ratio stands at 1.34, which means that the returns earned were 1.34 times the volatility taken on. In other words, for each unit of risk, the strategy generated a positive return, suggesting a reasonable risk-reward balance. At the trade level, the absence of closed trades listed means that there are no trade details to analyze; thus, it is hard to gauge specific patterns in profitability or consistency.
The monthly returns reveal that the strategy had 22 positive months compared to 13 negative months, indicating a tendency for more frequent gains. The average return during positive months was higher than the average loss during negative months, specifically demonstrating that gains were stronger on average, this pattern aligns with the strategy’s design to capitalize on upward momentum while managing risk through its exit criteria.
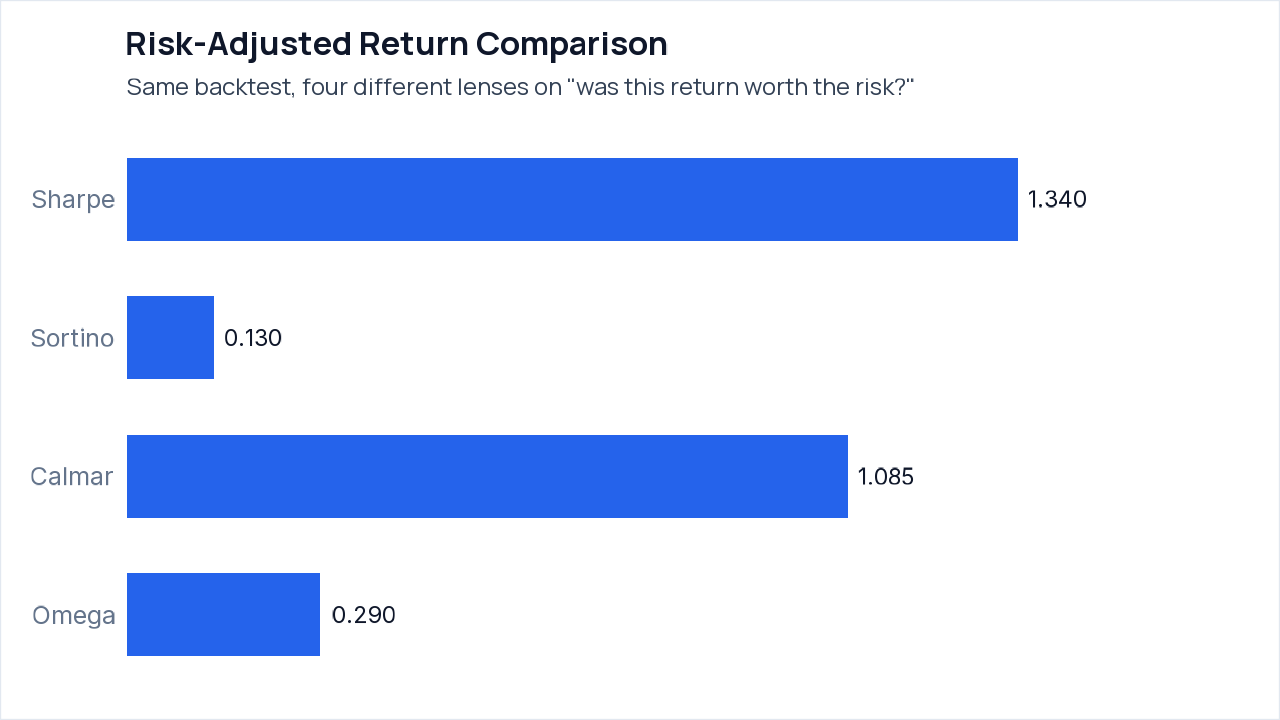
A raw return figure can be misleading because it doesn’t account for the risk taken to achieve those returns. For example, a strategy might return 20% by taking significant risks, but a more modest 10% return could be achieved with much less volatility.
In this backtest, the Sharpe ratio of 1.34 indicates that the strategy generated returns 1.34 times the total volatility, suggesting a reasonable risk-reward balance. The Sortino ratio of 0.13, however, focuses only on downside volatility, revealing that the risk of losing is not well compensated by the upside, which contrasts starkly with the higher Sharpe. The Calmar ratio of 1.08 compares the return to maximum drawdown, further underscoring the strategy’s susceptibility to significant declines.
The "Probability Sharpe > 0" at 99.15% suggests strong statistical confidence that the true Sharpe ratio is positive, which is meaningful. Additionally, since this backtest’s Sharpe ratio is statistically significant, we can trust it provides insightful data. For your own reports, start by comparing the Sharpe and Sortino ratios, followed by the Calmar ratio for a comprehensive risk assessment.
Where Did the Result Come From?
The results of this strategy are concentrated among just a few symbols. The analysis shows that out of the seven symbols traded, only three contributed significantly to the overall profit. Specifically, QQQ led with a net profit of $51,119 from 37 trades and a win rate of 54.1%. MSFT followed with $35,846 from 37 trades and a slightly lower win rate of 45.9%. In contrast, NVDA, while generating a profit of $15,656 from 41 trades, had a win rate of only 29.3%. Other symbols, such as AAPL, had a modest contribution of $6,664 from 37 trades, but there were no trades for XLF, XLP, and XLE.The trade-level significance test indicates that the results should be interpreted with caution. Since there were multiple trades across a few symbols and the p-value reflects the statistical relevance of the results, it is important to note that the nature of overlapping trades means the p-value serves as an indicative measure rather than conclusive evidence.
How Bad Did It Get?
The strategy experienced a maximum drawdown of 25.63%, which means that the account value fell by that percentage from its peak to its lowest point during the backtest. This drawdown lasted for approximately 193 days before hitting the trough and took an additional 60 days to recover. Such statistics indicate that a trader might face considerable losses before seeing their investment recover to previous highs.In terms of risk-adjusted return metrics, the Sharpe ratio is 1.34, suggesting that the returns generated were relatively favorable compared to the level of risk taken. However, the Sortino ratio of 0.13 indicates a substantial disparity between upside potential and downside risk. This divergence highlights a caveat: although the total returns are positive, they may not adequately compensate for the risks involved, especially given that the average drawdown length was 17.82 days. This risk profile should give potential traders pause, as it signals that while profits exist, they come with significant volatility.
The integrity audit failed due to two key issues: first, the trade list did not reconcile with the per-symbol trade statistics, indicating a potential mismatch in reported trades. Second, there was no verification of the gross long exposure relative to the portfolio equity, leaving uncertainty about the strategy’s true risk exposure. These failures suggest that the reported performance might not fully reflect reliable trade execution or risk management.
What Stood Out
- The strategy had a total return of 107.89%, but this was significantly lower than the benchmark’s return of 244,286.40%, highlighting a considerable performance gap.
- Despite a positive monthly return count of 22, the total profit did not keep pace, raising questions about the effectiveness of individual trades contributing to the overall strategy.
- The maximum drawdown of 25.63% indicates notable potential exposure to risk, which could be unexpected given the strategy’s positive return trend.
Limits of This Backtest
- The integrity audit failed, specifically highlighting that the trade list did not reconcile with per-symbol trade statistics, suggesting potential discrepancies in the reported performance.
- There were no closed trade details available, making it difficult to analyze specific performance metrics or patterns.
- The gross long exposure could not be verified relative to portfolio equity, meaning the reported performance may overstate actual returns.
- The total length of the backtest period is 9.00 years, which, while substantial, may not fully capture varying market conditions necessary for a comprehensive evaluation of the strategy.
Monthly Returns
Over the tracking period from January 2023 to January 2025, the strategy experienced a mix of monthly returns, with 22 positive months and 13 negative months. The best month was June 2024, which had a return of 24.48%. Conversely, the worst month was January 2025, with a return of -6.33%.
The most significant drawdown occurred between July 11, 2024, and April 16, 2025, where it reached a depth of -25.63%. This episode aligns with the overall trend of returns, showing that significant declines occurred during a challenging market period.
Conclusions
This backtest revealed a total return of 107.89% over nearly nine years, which amounted to a compounded annual growth rate (CAGR) of 8.47%. However, this performance significantly lagged behind the benchmark of an equal-weight buy-and-hold basket that returned an astonishing 244,286.40%.The primary caveat to consider is the considerable maximum drawdown of 25.63%, which indicates potential for substantial losses during the backtest period. Moreover, the integrity audit highlighted issues, particularly regarding the reconciliation of trade statistics, suggesting that the reported figures may not fully reflect reliable trade execution. Always remember, this walkthrough demonstrates past performance and does not predict future results. If you’re interested, feel free to explore your own strategy ideas using quantstr.at.
Ideas to Test Next
The strategy’s maximum drawdown of 25.63% indicates significant risk exposure, which could make it challenging for traders during downturns. Consider adjusting the exit conditions to include a stop-loss to potentially limit losses and manage risk more effectively.
Enter long when the price breaks above the 20-day high and the 10-day EMA is greater than the 30-day EMA. Exit when the price reaches the 10-day low or hits a trailing stop set at twice the ATR, or if the price falls below a stop-loss of 1.5% from the entry price.
More Backtests
- Can Keltner Channel Breakouts Beat Buy-and-Hold? A 3-Year Test on Tech Equities & QQQ
- MACD SMI Trend Following Across Sector & Global ETFs
- Building and Testing an RSI Mean-Reversion Strategy
Setup, Audit & Replication
Full per-symbol trade statistics ▾
Backtest Integrity Audit: 4 of 6 checks passed
- ✅ Headline Return Matches Ending vs Starting Equity: From dollars: 107.89% | Reported field: 107.89% | Gap: 0.000 pp
- ✅ Equity Curve Starts at Initial Equity and Ends at Ending Value: First point: $100,000 (initial $100,000) | Last point: $207,892 (ending $207,892)
- ✅ Monthly Returns Compound to Headline Return: Compounded months: 107.89% | Headline: 107.89% | Gap: 0.00 pp
- ⚠️ Trade List Reconciles With Per-Symbol Trade Statistics: Trade-list rows: 0 | open at end: 0 | closed per trade statistics: 152 | open rows isolated: yes
- ✅ Sharpe Ratio Consistent With Annualized Return and Volatility: Reported Sharpe: 1.34 | Annualized return / volatility: 1.34
- ⚠️ Gross Long Exposure Never Exceeds Portfolio Equity: No position series in results; cannot verify