Tag: volatility-breakout
Can Keltner Channel Breakouts Beat Buy-and-Hold? A 3-Year Test on Tech Equities & QQQ
What Did We Test?
This strategy uses a Keltner Channel Volatility Breakout approach, targeting stocks like QQQ, NVDA, AAPL, MSFT, AMD, and AMZN. The Keltner Channel consists of an upper band, a lower band, and a center line, measuring the average price along with average true range (ATR) to capture volatility and identify trends. The Average Directional Index (ADX) is also utilized, which indicates trend strength. Entering long positions when the price breaks above the upper band of the Keltner Channel, combined with an ADX value above 25, suggests a strong upward trend. Exiting positions occurs when the price falls below the center line of the channel.What Happened?
The backtest of the Keltner Channel Volatility Breakout strategy ran from August 29, 2023, to August 27, 2026. The starting capital of $100,000 grew to approximately $207,035, resulting in a total return of 107% and a compound annual growth rate (CAGR) of 27.5%. However, the strategy lagged behind an equal-weight buy-and-hold basket of the same stocks, which achieved a total return of 166% and a CAGR of 38.7%. In contrast, it outperformed the buy-and-hold SPY, which returned 77%.A significant consideration is that the strategy’s results were based on 97 closed trades (+1 still open), which indicates that performance may depend heavily on a limited number of trades. The maximum drawdown for this strategy was approximately 29.9%, compared to the equal-weight benchmark’s max drawdown of 28.9%, suggesting a slightly worse risk profile.
How Did It Compare With the Benchmarks?
The Keltner Channel Volatility Breakout strategy generated a total return of 107% over the 3-year period, resulting in an ending equity value of approximately $207,035 from an initial equity of $100,000. The strategy executed 97 closed trades, with a win rate of about 41%. When compared to the equal-weight buy-and-hold strategy for the same stocks, which achieved a total return of 166%, this strategy lagged significantly by approximately 59%. However, it outperformed the SPY buy-and-hold strategy, which returned 77%, by around 30%.
The Sharpe ratio of 1.12 indicates that the strategy earned 1.12 units of return for every unit of risk taken, which is generally considered acceptable in quantitative trading. At the trade level, the average closed-trade profit and loss was about $1,107. While some trades were profitable, the distribution revealed that a small number of large gains were responsible for a significant portion of the overall profit, indicating a "few big winners" trading pattern.
Monthly returns averaged about 14 positive months versus 20 negative months, with average gains of around 12% during winning months and smaller average losses of about 3%. This suggests that while the strategy struggled to avoid bad months, it was capable of capturing larger upswings, aligning with its volatility breakout approach. However, the strategy faced a maximum drawdown of 30%, indicating considerable risk during its worst performance period.
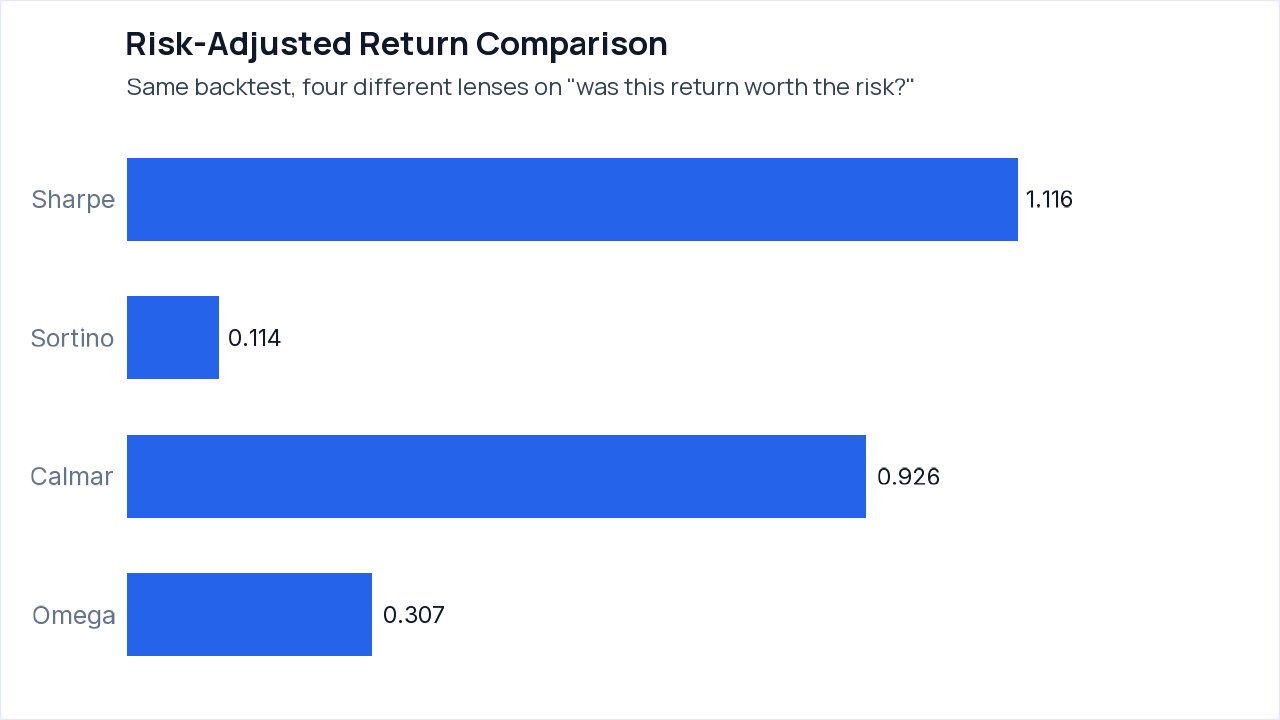
Understanding raw return figures can be misleading, as they fail to reveal the underlying risks involved. For instance, a strategy returning 20% with high volatility may not be preferable to one generating 10% returns with a smoother ride. In this backtest, the Sharpe ratio of 1.12 indicates that the strategy earned about 1.12 units of return per unit of total volatility, reflecting an acceptable risk-return trade-off. The Sortino ratio, at 0.11, looks specifically at downside volatility, signaling concerns since it shows that returns aren’t proportionate to the risks incurred when the strategy performed poorly. The Calmar ratio of 0.93 compares returns relative to the maximum drawdown, offering a different angle that emphasizes the substantial drawdown of nearly 30%.
A key metric, "Probability Sharpe > 0," sits at 97.94%, indicating high confidence that the strategy’s true Sharpe ratio is greater than zero, although the minimum track record needed to ensure this confidence is 487 observations. In this case, the Sharpe ratio is statistically significant, meaning it likely reflects a real pattern rather than being a result of chance. When reviewing your own quantstr.at report, it’s useful to examine the Sharpe and Sortino ratios together to understand risk-adjusted returns, followed by the Calmar ratio for additional insights into maximum drawdown.
Where Did the Result Come From?
The results of this backtest show a significant reliance on a few symbols for the overall performance. While the strategy is built around six symbols, the bulk of the profit is concentrated in just a couple of them. Notably, QQQ accounted for a net profit of $54,264 from 14 trades, translating to a win rate of 57.1% and a profit factor of 8.10. On the other hand, AMZN showed disappointing results, with a net loss of $15,936 across 16 trades, which reflects a win rate of only 25.0% and a low profit factor of 0.21.The significance test indicates that the mean return per trade was 12.22%, with a 95% confidence interval for the mean ranging from -8.03% to 32.46%. The t-statistic was 1.20, and the two-sided p-value was 0.2339, suggesting there isn’t strong evidence that the strategy was definitively effective, primarily due to the small sample size of trades. This means that the returns could be due to random chance rather than a robust underlying strategy.
How Bad Did It Get?
This Keltner Channel Volatility Breakout strategy faces noticeable risks, particularly highlighted by its maximum drawdown of 30%. This means that during its worst period, the strategy could lose close to one-third of its equity before starting to recover. The recovery from this drawdown took about 60 days, indicating significant potential stress over an extended time frame.The risk-adjusted return metrics present a mixed picture. With a Sharpe ratio of 1.12, the strategy earned slightly more than one unit of return for each unit of risk taken, which is generally acceptable. However, the Sortino ratio, at 0.11, indicates that the returns were not proportionate to the downside risk. This suggests that while there were some profitable trades, the good months did not sufficiently outweigh the less favorable ones.
An integrity audit revealed some flaws in the backtesting process, specifically regarding exposure checks. The peak gross long exposure exceeded the actual equity in the account. This means that the reported returns might overstate what a strictly unleveraged account could have achieved. Additionally, the failed percentage checks imply that some of the data’s presentation may lack precision. Hence, while the strategy shows promise, caution is warranted when interpreting its performance metrics due to these inherent risks and issues.
What Stood Out
- The strategy’s total return of 107% significantly lagged behind the equal-weight buy-and-hold benchmark return of 166%, presenting a difference of about 59%.
- Despite a win rate of 41%, the strategy was able to achieve a profit factor of 2.11, indicating that its profitable trades substantially outweighed its losses.
- Some of the most significant gains came from a few standout trades, as excluding the five largest winners resulted in a net loss of about 14%.
Limits of This Backtest
- The strategy generated only 97 closed trades, which may limit statistical significance and overall reliability.
- There was a maximum drawdown of 30%, indicating considerable risk during the worst performance period.
- An integrity audit revealed issues with exposure checks, suggesting that the reported returns could overstate what an unleveraged account could realistically achieve.
- Monthly returns demonstrated more negative months (20) than positive months (14), which indicates more frequent losing periods over the test duration.
Monthly Returns
The backtest reported returns across 37 months, with 14 months showing positive returns, 20 months negative, and 3 months flat. The best month was May 2026, achieving a return of 26%, while the worst was July 2026, with a decline of 7%.
Notably, the largest drawdown episode occurred between July 2024 and April 2025, reaching a depth of 30% over 193 days. This episode aligns with several negative monthly returns, particularly during 2025, which included months of losses.
Conclusions
This backtest of the Keltner Channel Volatility Breakout strategy yielded a total return of 107% over three years, increasing the equity from $100,000 to approximately $207,035. While it did outperform the SPY buy-and-hold strategy, which returned 77%, it lagged significantly behind an equal-weight buy-and-hold basket of the same stocks, which achieved a total return of 166%. The strategy maintained a win rate of about 41% across 97 closed trades, with some large gains contributing disproportionately to the overall profit, implying a reliance on a few big winners.One major caveat to consider is the maximum drawdown of approximately 30%, indicating significant risk during its worst performance phase. This drawdown required about 60 days to recover, highlighting potential stress for traders. It’s important to note that this analysis is purely for educational purposes, not investment advice, and past performance does not guarantee future results. Readers are encouraged to explore their own strategy ideas using quantstr.at.
Ideas to Test Next
The strategy’s maximum drawdown of 30% indicates significant risk during adverse market conditions. By adding a stop-loss, you may help limit losses during downturns, enhancing risk management and potentially improving overall performance.
Trade QQQ, NVDA, AAPL, MSFT, AMD, and AMZN using a Keltner Channel Volatility Breakout strategy. Enter long when price breaks above the 20-period upper band and 14-period ADX > 25 (confirming trend strength). Exit when price closes below the 20-period EMA center line. Additionally, set a stop-loss to exit the position if losses reach 5%.
More Backtests
- MACD SMI Trend Following Across Sector & Global ETFs
- Building and Testing an RSI Mean-Reversion Strategy
- Does a Market Trend Filter Beat Buy-and-Hold? An Out-of-Sample Test on 989 Stocks
Setup, Audit & Replication
Full per-symbol trade statistics ▾
View R Strategy Code ▾
# Load required libraries
library(quantmod)
library(quantstrat)

# Set parameters
start_date <- '2023-08-29'
end_date <- '2026-08-27'
init_equity <- 100000
symbols <- c('QQQ', 'AAPL', 'MSFT', 'NVDA', 'AMD', 'AMZN')

# Get historical data
getSymbols(symbols, from = start_date, to = end_date)

# Initialize the portfolio, account, and orders
initPortf('KeltnerADX', symbols = symbols)
initAcct('KeltnerADX', portfolios = 'KeltnerADX', initEq = init_equity)
initOrders(portfolio = 'KeltnerADX')

# Define the strategy
strategy.st <- 'KeltnerADX'
rm <- 'KeltnerADX'

# Initialize strategy
initStrategy(strategy.st)

# Define indicators
add.indicator(strategy = strategy.st, name = 'EMA', arguments = list(x = quote(Cl(mktdata)), n = 20), label = 'EMA20')
add.indicator(strategy = strategy.st, name = 'KeltnerChannel', arguments = list(HLC = quote(HLC(mktdata)), n = 20, sd = 1.5), label = 'KC')
add.indicator(strategy = strategy.st, name = 'ADX', arguments = list(x = quote(HLC(mktdata)), n = 14), label = 'ADX')

# Define signals
add.signal(strategy = strategy.st, name = 'sigThreshold', arguments = list(column = 'KC.upper', threshold = 0, relationship = 'gt'), label = 'longEntry')
add.signal(strategy = strategy.st, name = 'sigThreshold', arguments = list(column = 'EMA20', threshold = 0, relationship = 'lt'), label = 'longExit')

# Define rules
add.rule(strategy = strategy.st, name = 'ruleSignal', arguments = list(sigcol = 'longEntry', sigval = TRUE, ordertype = 'market', orderside = 'long', replace = FALSE, TxnFees = 0), type = 'enter')
add.rule(strategy = strategy.st, name = 'ruleSignal', arguments = list(sigcol = 'longExit', sigval = TRUE, ordertype = 'market', orderside = 'long', replace = TRUE, TxnFees = 0), type = 'exit')

# Apply the strategy
applyStrategy(strategy = strategy.st, portfolios = 'KeltnerADX')

# Update the portfolio
updatePortf('KeltnerADX')

# Get performance summary
chart.Posn('KeltnerADX', Symbol = 'QQQ')

# Print final portfolio summary
getPortfolio('KeltnerADX')
View Python Strategy Code ▾
import yfinance as yf
import pandas as pd
import vectorbt as vbt

# Set parameters
symbols = ['QQQ', 'AAPL', 'MSFT', 'NVDA']
start_date = '2023-08-29'
end_date = '2026-08-27'

# Download historical data
prices = yf.download(symbols, start=start_date, end=end_date)['Adj Close']

# Calculate indicators
ema20 = prices.ewm(span=20).mean()
upper_band = prices.rolling(window=20).mean() + (prices.rolling(window=20).std() * 1.5)
lower_band = prices.rolling(window=20).mean() - (prices.rolling(window=20).std() * 1.5)
adx = vbt.ADX.run(prices, window=14).adx

# Define entry and exit signals
long_entry = (prices > upper_band) & (adx > 25)
long_exit = prices < ema20

# Create portfolio
portfolio = vbt.Portfolio.from_signals(prices, long_entry, long_exit, init_cash=100000)

# Print portfolio stats
print(portfolio.stats())
View Quarto Markdown Replication (.qmd) ▾
---
title: "Strategy Replication Guide: Keltner ADX Volatility Breakout Strategy"
format: html
editor: visual
execute:
  eval: false
---

# Overview
This Quarto Markdown notebook provides reproducible R and Python code to replicate the **Keltner ADX Volatility Breakout Strategy** backtest (2023-08-29 to 2026-08-27).

## R Replication (quantstrat)

```{r}
#| label: r-strategy-replication
#| message: false
#| warning: false

# Load required libraries
library(quantmod)
library(quantstrat)

# Set parameters
start_date <- '2023-08-29'
end_date <- '2026-08-27'
init_equity <- 100000
symbols <- c('QQQ', 'AAPL', 'MSFT', 'NVDA', 'AMD', 'AMZN')

# Get historical data
getSymbols(symbols, from = start_date, to = end_date)

# Initialize the portfolio, account, and orders
initPortf('KeltnerADX', symbols = symbols)
initAcct('KeltnerADX', portfolios = 'KeltnerADX', initEq = init_equity)
initOrders(portfolio = 'KeltnerADX')

# Define the strategy
strategy.st <- 'KeltnerADX'
rm <- 'KeltnerADX'

# Initialize strategy
initStrategy(strategy.st)

# Define indicators
add.indicator(strategy = strategy.st, name = 'EMA', arguments = list(x = quote(Cl(mktdata)), n = 20), label = 'EMA20')
add.indicator(strategy = strategy.st, name = 'KeltnerChannel', arguments = list(HLC = quote(HLC(mktdata)), n = 20, sd = 1.5), label = 'KC')
add.indicator(strategy = strategy.st, name = 'ADX', arguments = list(x = quote(HLC(mktdata)), n = 14), label = 'ADX')

# Define signals
add.signal(strategy = strategy.st, name = 'sigThreshold', arguments = list(column = 'KC.upper', threshold = 0, relationship = 'gt'), label = 'longEntry')
add.signal(strategy = strategy.st, name = 'sigThreshold', arguments = list(column = 'EMA20', threshold = 0, relationship = 'lt'), label = 'longExit')

# Define rules
add.rule(strategy = strategy.st, name = 'ruleSignal', arguments = list(sigcol = 'longEntry', sigval = TRUE, ordertype = 'market', orderside = 'long', replace = FALSE, TxnFees = 0), type = 'enter')
add.rule(strategy = strategy.st, name = 'ruleSignal', arguments = list(sigcol = 'longExit', sigval = TRUE, ordertype = 'market', orderside = 'long', replace = TRUE, TxnFees = 0), type = 'exit')

# Apply the strategy
applyStrategy(strategy = strategy.st, portfolios = 'KeltnerADX')

# Update the portfolio
updatePortf('KeltnerADX')

# Get performance summary
chart.Posn('KeltnerADX', Symbol = 'QQQ')

# Print final portfolio summary
getPortfolio('KeltnerADX')
```

## Python Replication (VectorBT)

```{python}
#| label: python-strategy-replication

import yfinance as yf
import pandas as pd
import vectorbt as vbt

# Set parameters
symbols = ['QQQ', 'AAPL', 'MSFT', 'NVDA']
start_date = '2023-08-29'
end_date = '2026-08-27'

# Download historical data
prices = yf.download(symbols, start=start_date, end=end_date)['Adj Close']

# Calculate indicators
ema20 = prices.ewm(span=20).mean()
upper_band = prices.rolling(window=20).mean() + (prices.rolling(window=20).std() * 1.5)
lower_band = prices.rolling(window=20).mean() - (prices.rolling(window=20).std() * 1.5)
adx = vbt.ADX.run(prices, window=14).adx

# Define entry and exit signals
long_entry = (prices > upper_band) & (adx > 25)
long_exit = prices < ema20

# Create portfolio
portfolio = vbt.Portfolio.from_signals(prices, long_entry, long_exit, init_cash=100000)

# Print portfolio stats
print(portfolio.stats())
```
Backtest Integrity Audit: 7 of 9 checks passed
- ✅ Headline Return Matches Ending vs Starting Equity: From dollars: 107.03% | Reported field: 107.03% | Gap: 0.000 pp
- ✅ Equity Curve Starts at Initial Equity and Ends at Ending Value: First point: $100,000 (initial $100,000) | Last point: $207,035 (ending $207,035)
- ✅ Monthly Returns Compound to Headline Return: Compounded months: 107.03% | Headline: 107.03% | Gap: 0.00 pp
- ✅ Trade List Reconciles With Per-Symbol Trade Statistics: Trade-list rows: 98 | open at end: 1 | closed per trade statistics: 97 | open rows isolated: yes
- ✅ Sharpe Ratio Consistent With Annualized Return and Volatility: Reported Sharpe: 1.12 | Annualized return / volatility: 1.12
- ⚠️ Gross Long Exposure Never Exceeds Portfolio Equity: Peak gross long exposure was 218.9% of contemporaneous equity (on 2024-08-16)
- ✅ Backtest Generated Closed Trades (>0): Total closed trades executed: 97
- ✅ Reproducible R and Python Code Files Present: strategy_code.R: present | python_vectorbt.py: present
- ⚠️ Prose Percentages Are Integer-Rounded to Whole Numbers: Found unrounded percentages: 29.92%, 13.60%, 681.43%